The author is a research assistant professor in the department of agricultural and applied economics at the University of Missouri.
In determining how to employ margin insurance, understanding the premium cost relative to the expected payout for your dairy farm business will generally be the critical driver affecting coverage level choice when USDA announces final rules on the new farm bill.
Since the passage of the farm bill early this year, there has been intense focus on the new dairy provisions. This is not surprising given these new dairy provisions found in the Agricultural Act of 2014 represent the largest dairy policy change in decades.
There has been much speculation about what the changes will ultimately mean to the industry, but the exact operation of the new Margin Protection Program (MPP) will remain unknown until USDA promulgates or announces final regulations later this summer. However, there is information available for dairy producers to begin to think through their own participation in the MPP.
Will it work for you?
The first critical step a producer must take is to determine whether the new MPP actually provides risk protection for their operation when their margins are low. In simple terms, if an individual producer experiences low margins at different points in time than the national margin calculation implies, then the MPP will be a less effective tool in offsetting low margin periods on their operation.
Correlation is one statistical method that can be used to measure this margin comparison, although a simple visual comparison of historical producer and national margins can also provide the needed information to determine how well the MPP may perform for an individual producer. Although conversations with some producers suggest they will not participate in the MPP because their margin is different than the national margin, I have not yet seen a comparison of an individual producer's margin to the national margin that would suggest that the MPP would not be a potential risk management tool for their operation.
Risk tolerance is important
The question many producers continue to ask is what level of margin coverage they should enroll in under the MPP. The answer is definitely not the same for all producers across the country. The level of risk an individual operation can handle is important. If an operation has an above average debt load, then that operation may want to enroll in higher MPP coverage levels. On the other hand, a debt-free operation may determine it can handle substantial risk and will purchase little, if any, MPP coverage. Lenders may provide some guidance in terms of MPP participation.
Dairy producers must understand they are not making the MPP coverage level choice in isolation. The exact margin returned from the marketplace during low margin periods will depend in part on overall producer participation in the MPP. High aggregate participation in the MPP will extend periods of low margins as MPP payments will help offset low marketplace margins and delay supply adjustment.
Payout linked to coverage
Once a dairy producer determines that the MPP fits in their risk management toolbox, they need to decide the margin level they wish to cover. The MPP margin level choice will occur on an annual basis. Depending on when the coverage decision must be made relative to the start of coverage (a fact that will be made clear when final regulations are available), producers may be able to use current information to make a more strategic coverage level choice.
This would be especially true if margins were extremely low when the margin level choice was made and if the deadline was close to the start of coverage. However, the volatility the dairy industry has faced the last several years suggests current margin levels will not always provide producers with the exact level of coverage they should choose to maximize program returns.
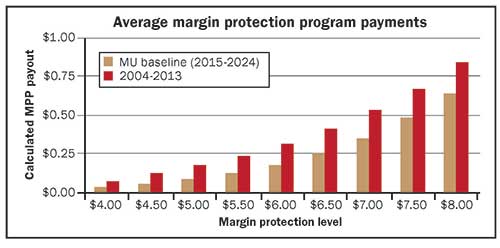
The more important focus for producers in advance of MPP implementation is to think through their average margin coverage choice during the life of the farm bill. There are two alternatives available to producers in forming their average margin coverage level. The chart shows the historical average margin payouts over the 2004 to 2013 period and the expected forward-looking payouts from the most current long-term baseline using stochastic analysis developed at the University of Missouri (MU).
The chart shows that over the 2004 to 2013 period the average payout at $6.50 coverage was $0.41 per hundredweight of insured milk. This average MPP payout corresponds to receiving payments 20 percent of the time. This historical calculation uses actual milk and feed prices over the time period. It is important to note that had the MPP been operating over this historical period that margins would have been different. In fact, margins would have been lower as the MPP would have slowed milk supply adjustment during the low margin periods.
The forward-looking baseline expected margin payouts are dependent on the assumption that 70 percent of milk production participates at an average margin coverage level of $6.50 per hundredweight in the MPP. This baseline also assumes the MPP continues after the current expiration date of December 31, 2018. This baseline study includes 500 unique market outcome paths that attempt to replicate the expected market volatility in the future and does include some outcomes that rival the margin lows of 2009 and the margin highs of 2013.
The average MPP payouts shown in the stochastic analysis are slightly lower than in the historical period, reflecting slightly higher average margins in the stochastic baseline relative to the historical period that included the low margin periods of 2009 and 2012.
The best choice?
The discussion of the "best" margin coverage level depends on the size of the dairy operation since MPP premium levels are lower for those with a production history that is less than 4 million pounds.
Those producing under 4 million pounds of milk. The chart shows that the average payout using either the historical period or the stochastic baseline exceeds the premium cost at all protection levels for producers with less than 4 million pounds of production history. Using these two margin averages suggest those dairy producers with less than 4 million pounds of production history should purchase higher levels of margin coverage on average, and they in turn will receive higher average net payouts at the highest coverage level despite the higher premium. This discussion is focused on the average choice. Producers may make annual adjustments depending on the current situation and their risk tolerance.
For dairy producers with production history in excess of 4 million pounds. The average margin coverage decision depends in part upon by how much they exceed 4 million pounds of production history. A very large producer would be required to pay a premium very close to $1.36 per hundredweight to obtain $8 margin coverage. This premium cost outweighs the average MPP payout shown for $8 coverage using either history or the current stochastic baseline. It would appear that the crossover point, which is where the premium cost exceeds the expected average payout, occurs somewhere in the $6.50 range for those well above 4 million pounds of production history.
Bringing it into focus
These average payout alternatives should begin to clarify the MPP coverage level choices to be made by dairy producers. Risk tolerance and individual margin to national margin correlation should also be factored into the decision made by an individual producer regarding the level of MPP participation. While the current margin situation may influence the coverage choice of a particular year, understanding the premium cost relative to the expected payout for your operation will generally be the critical driver affecting coverage level choice.
This article appears on page 412 of the June 2014 issue of Hoard's Dairyman.
Since the passage of the farm bill early this year, there has been intense focus on the new dairy provisions. This is not surprising given these new dairy provisions found in the Agricultural Act of 2014 represent the largest dairy policy change in decades.
There has been much speculation about what the changes will ultimately mean to the industry, but the exact operation of the new Margin Protection Program (MPP) will remain unknown until USDA promulgates or announces final regulations later this summer. However, there is information available for dairy producers to begin to think through their own participation in the MPP.
Will it work for you?
The first critical step a producer must take is to determine whether the new MPP actually provides risk protection for their operation when their margins are low. In simple terms, if an individual producer experiences low margins at different points in time than the national margin calculation implies, then the MPP will be a less effective tool in offsetting low margin periods on their operation.
Correlation is one statistical method that can be used to measure this margin comparison, although a simple visual comparison of historical producer and national margins can also provide the needed information to determine how well the MPP may perform for an individual producer. Although conversations with some producers suggest they will not participate in the MPP because their margin is different than the national margin, I have not yet seen a comparison of an individual producer's margin to the national margin that would suggest that the MPP would not be a potential risk management tool for their operation.
Risk tolerance is important
The question many producers continue to ask is what level of margin coverage they should enroll in under the MPP. The answer is definitely not the same for all producers across the country. The level of risk an individual operation can handle is important. If an operation has an above average debt load, then that operation may want to enroll in higher MPP coverage levels. On the other hand, a debt-free operation may determine it can handle substantial risk and will purchase little, if any, MPP coverage. Lenders may provide some guidance in terms of MPP participation.
Dairy producers must understand they are not making the MPP coverage level choice in isolation. The exact margin returned from the marketplace during low margin periods will depend in part on overall producer participation in the MPP. High aggregate participation in the MPP will extend periods of low margins as MPP payments will help offset low marketplace margins and delay supply adjustment.
Payout linked to coverage
Once a dairy producer determines that the MPP fits in their risk management toolbox, they need to decide the margin level they wish to cover. The MPP margin level choice will occur on an annual basis. Depending on when the coverage decision must be made relative to the start of coverage (a fact that will be made clear when final regulations are available), producers may be able to use current information to make a more strategic coverage level choice.
This would be especially true if margins were extremely low when the margin level choice was made and if the deadline was close to the start of coverage. However, the volatility the dairy industry has faced the last several years suggests current margin levels will not always provide producers with the exact level of coverage they should choose to maximize program returns.
The more important focus for producers in advance of MPP implementation is to think through their average margin coverage choice during the life of the farm bill. There are two alternatives available to producers in forming their average margin coverage level. The chart shows the historical average margin payouts over the 2004 to 2013 period and the expected forward-looking payouts from the most current long-term baseline using stochastic analysis developed at the University of Missouri (MU).
The chart shows that over the 2004 to 2013 period the average payout at $6.50 coverage was $0.41 per hundredweight of insured milk. This average MPP payout corresponds to receiving payments 20 percent of the time. This historical calculation uses actual milk and feed prices over the time period. It is important to note that had the MPP been operating over this historical period that margins would have been different. In fact, margins would have been lower as the MPP would have slowed milk supply adjustment during the low margin periods.
The forward-looking baseline expected margin payouts are dependent on the assumption that 70 percent of milk production participates at an average margin coverage level of $6.50 per hundredweight in the MPP. This baseline also assumes the MPP continues after the current expiration date of December 31, 2018. This baseline study includes 500 unique market outcome paths that attempt to replicate the expected market volatility in the future and does include some outcomes that rival the margin lows of 2009 and the margin highs of 2013.
The average MPP payouts shown in the stochastic analysis are slightly lower than in the historical period, reflecting slightly higher average margins in the stochastic baseline relative to the historical period that included the low margin periods of 2009 and 2012.
The best choice?
The discussion of the "best" margin coverage level depends on the size of the dairy operation since MPP premium levels are lower for those with a production history that is less than 4 million pounds.
Those producing under 4 million pounds of milk. The chart shows that the average payout using either the historical period or the stochastic baseline exceeds the premium cost at all protection levels for producers with less than 4 million pounds of production history. Using these two margin averages suggest those dairy producers with less than 4 million pounds of production history should purchase higher levels of margin coverage on average, and they in turn will receive higher average net payouts at the highest coverage level despite the higher premium. This discussion is focused on the average choice. Producers may make annual adjustments depending on the current situation and their risk tolerance.
For dairy producers with production history in excess of 4 million pounds. The average margin coverage decision depends in part upon by how much they exceed 4 million pounds of production history. A very large producer would be required to pay a premium very close to $1.36 per hundredweight to obtain $8 margin coverage. This premium cost outweighs the average MPP payout shown for $8 coverage using either history or the current stochastic baseline. It would appear that the crossover point, which is where the premium cost exceeds the expected average payout, occurs somewhere in the $6.50 range for those well above 4 million pounds of production history.
Bringing it into focus
These average payout alternatives should begin to clarify the MPP coverage level choices to be made by dairy producers. Risk tolerance and individual margin to national margin correlation should also be factored into the decision made by an individual producer regarding the level of MPP participation. While the current margin situation may influence the coverage choice of a particular year, understanding the premium cost relative to the expected payout for your operation will generally be the critical driver affecting coverage level choice.