
On Oct. 28th, the IFCN (International Farm Comparison Network), has officially released its IFCN Dairy Report 2013 during the FIL-IDF World Dairy Summit in Yokohama (Japan).
This yearly report, the 14th of a very well appreciated series started in the year 2000, offers a compelling presentation of IFCN economic researches and analyses on the dairy world on a global and local level.
The report covers:
· Global comparison of "typical farms"
· Global monitoring of dairy economic indicators
· Country based milk production fact sheets (95 Countries covered)
And it also contains special studies such as:
· Cost of milk production and its main drivers (over 50 Countries covered)
· Effects of increasing concentrate price on cost of milk production
· Benchmarking consumptive water use in global milk production
· "Real time farm economics" method development
· IFCN "standard classes" methodology: a tool to visualize structural changes
Out of its three decade history, the IFCN Dairy Report has gained importance over time being now considered as unrivalled knowledge tool and standard publication for a global understanding of dairy economics among the most important companies and institution operating in the dairy chain.
For more information on content and on sales details please contact IFCN at info@ifcndairy.org
Overview on milk prices and production costs world wide
Authors: Torsten Hemme, Asaah Ndambi, Eva Schröer-Merker and dairy researchers from 95 countries participating in the International Farm Comparison Network
Introduction
Milk production worldwide is practiced by around 122 million dairy farms (IFCN estimate) keeping 363 million milking cows and buffaloes. This means that the world average farmer keeps 3 milk animals with an average annual milk yield of approximately 2100 kg/animal/year. Of course building averages is an oversimplification. There is a wide range of dairy farms in the world keeping less than 3 cows per farm on the one side and on the other side in some countries, dairy farms are much bigger and keep over 1000 cows per farm.
The simple example shows that milk production is performed distinctively in different countries and their dairy regions. The dairy farming systems differ significantly in terms of farm size, housing, milking and feeding systems. This article follows the approach of the International Farm Comparison Network (IFCN). It is a global network of dairy researchers, from 95 countries. The network focuses on analysing dairy farming systems and their milk production costs. It is coordinated by the IFCN Dairy Research Center (DRC) at CAU University Kiel Germany (www.ifcndairy.org).
Milk and feed prices development 1996-2013
Figure 1 describes the development of the world market prices for milk and feed. The world milk prices are based on the weighted average of 3 IFCN world price indicators: skim milk powder & butter (35%); cheese & whey (45%) and whole milk powder (20%). The IFCN world feed price indicator represents the world market price level for feed. The calculated feed price indicator is based on the price for a diet comprising 70% corn (energy feed) and 30% soybean meal (protein feed). The milk : feed price ratio indicates how much feed a dairy farmer receiving global milk prices and paying global feed prices can buy, after selling one kg of milk. The ratio is defined as favourable, when it is >=1.5 and general one can conclude that the higher the ratio, the more favourable intensive feeding is considered.
Besides this commonly used ratio IFCN has developed a new farm economic indicator. This is the margin over compound feed costs. This indicator assumes an average feed intensity of 300 g compound feed per 1 kg milk. This feed intensity could represent a farm with a milk yield of 8000 kg milk / cow and year using 2.4 t of compound feed per year. The key improvement is that the milk : feed price ratio is weighting milk and feed price changes 1 to 1 where the margin indicator is weighting the feed price based on the kg compound feed fed per kg milk.
In the beginning of the year 2006, the milk price indicator started showing a rollercoaster behaviour of increasing prices and reached a peak of 53.7 US-$/100 kg ECM (Energy corrected milk 4% fat, 3.3% protein) milk in November 2007. However, the increase in milk price was not significantly associated with the feed price, as the gap between the two prices increased in 2007 reaching 32.3 US-$.
In 2008, the milk price fluctuated strongly and fell from a high level of 50.2 US-$/100 kg ECM milk in January 2008 to a low level of 19.3 US-$/100 kg ECM milk in Feb 2009. Nevertheless, the price increased to a level of 41.7 US-$ at the end of year 2009, making it a year of high fluctuations and a comparatively low average price. In 2010, the peak price was 41.3 US-$ and the amplitude of price fluctuation was lower than in the two previous years.
In contrast to the milk price, the feed price increased at the end of 2010 and beginning of 2011, reaching a level of 31 US-$/100 kg feed. In contrast to the feed price, the milk price followed a downward trend reaching 37.3 US-$ in April 2012. The redemption of milk prices began in January 2013 with the level of 40.2 US-$/100. The high acceleration of the milk price increase led to overtake the historical price peak of November 2007 and it ended the Q1-2013 with the level of 55 US-$/100 kg in April.
Following the prices of milk and feed, it is easy to observe the three main events. The rollercoaster period between January 2007 and January 2010, which was determined by a high fluctuation of prices (max range 34 US-$/100kg ECM) and the milk : feed price indicator between 2.9 and below 1.0. It led fast from a very profitable situation in production to a negative margin over compound feed, which decreased much below the average of 29.2 $. This phenomenon touched especially milk producers which are based on the more intensive compound feeding systems like the USA and countries in EU.
The second period was a period of relative stability which lasted for 2 years between January 2010 and January 2012. In this time, the milk price and feed price followed almost the same trend, allowing dairy farmers to produce milk with a milk : feed ratio below the long-term average from end 2010 but still around 1.5 and on the other hand to keep a positive margin over the compound feed cost which was higher than the average. This example shows that two different indicators can give different messages. From the IFCN perspective the margin over compound feed indicator is better describing dairy farm economics, since it considers the feed intensity.
The third scenario started to develop in the beginning of 2012 when the milk prices dropped down and feed prices rose towards new highs until mid of the year. This impact had a very negative effect on dairy farm economics as the two indicators (milk : feed price ratio and margin) are showing.
Starting in August we saw until mid of 2013 a sharp rise in milk prices and a decline in feed prices. Both farm economic indicators show a positive development.
Here the margin indicator is the better indictor to track dairy farm economics. It shows clearly that that dairy farm economics reach a similar level as seen in 2007, once dairy farmers would receive a milk price which is rising like the world market price. This analysis has been done for a moderate intensive dairy farming system of e.g. 8000 kg/cow and year. Farming systems which operate at lower milk yield and lower use of compound feed per kg milk the fluctuation of the margin over compound feed is much less and nearly only influenced by milk price developments. On the other hand dairy farming systems with much higher milk yields and higher compound feed use can show much more volatile margins, especially when exposed to world market prices.
Cost of milk production 2012 by world region
The annual IFCN work of comparing typical farms around the world has been an on-going process since the year 2000. Since then, the number of countries participating has increased from 8 to 51. Moreover, the number of dairy farm types analysed has increased from 21 to 178.
The IFCN methodology applied for data collection, economic analysis and results validation is using the three elements:
a) a network approach of research cooperating continuously
b) the concept of typical farms described below and
c) a standard model TIPI-CAL (Technology Impact Policy Impact CALculation model) to insure technical comparability of indicators.
A typical farm represents the most common production system which produces a significant proportion of milk in a country or a region. Usually, two farm types are used per dairy region the first represents an average farm and the second a larger farm type. The typical farms were built and validated by a combination of accounting statistics and a panel of dairy experts. The data collection and validation were done by researchers in the represented countries, researchers in the IFCN Dairy Research Center and also during the IFCN Dairy Conference held in June 2013 in Turkey.
ECM correction: As the dairy farms operate with milk of very different fat/protein content, the IFCN uses the energy correct milk (ECM) approach to standardise milk volumes to 4% fat and 3.3% protein. The following formula was used: ECM milk = (milk production * (0.383 * % fat + 0.242 * % protein + 0.7832) / 3.1138).
Cost indicator: The IFCN uses the indicator cost of milk production only which can be directly related to a milk price. This cost includes all costs from the profit & loss account of the farm. From this cost level, the non-milk returns from sales of cull cows, heifers, calves, manure, etc. and also returns from coupled direct payments have been deducted. Furthermore, also the opportunity costs for own labour, land and capital are included. For creation of the world map, the average size farm from each country was used.
In Figure 2, a simplified global overview on costs of milk production is shown. The illustration is based on the results of the typical average sized farm analysed per country in 2012. The results can be summarised as follows:
Cost range: Cost of milk production ranges from 4 US-$ per 100 kg milk in extensive farming systems in Cameroon (where beef is the major output and milk is a side product) to 128 US-$ for an average sized farm in Japan. The average cost over all countries analysed was 46 US-$/100 kg milk.
Low cost regions: Based on the average sized farms, three low cost regions have been identified: a) Argentina, Peru and Uruguay b) Central and Eastern Africa c) Central and Eastern Europe. Some selected countries in Asia (except Japan and large farms from China) also have low costs.
Western Europe: The leading farms in Western Europe had costs in the range from 40 55 US-$. On an average, the cost in Western Europe decreased by 1.1 US-$ in 2012 compared to 2011 mainly due to the weakening of the Euro to the US-$.
The US: The small farms in Wisconsin and New York had a cost of 50 US-$. Within the USA, the large farm from California had the lowest cost of about 33 US-$. In general, the average costs of all typical farms analysed in USA did not change and stayed at a level of 41.4 US-$ in 2012 compared to 2011(41.02 US-$).
Oceania: The cost level in Oceania was about 35 US-$.
The CEEC: The average of all household farms from the CEEC witnessed a slight decrease in costs, also driven by devaluation of the local currencies to the US-$.
In the year 2012, the increase of the cost of milk production (in national currency terms) continued in most dairy farms in the world following a rise in price of major input items (feed, labour and land) in many countries. But on the contrary to the year before, these higher input costs were not counteracted by a higher milk price quite the reverse, the milk price stayed stable or even decreased in many countries leading to worsening farm economics.
Cost of milk production developments 2000 2012
The results shown in Figure 3 reflect the situation of a typical average sized dairy farm from New Zealand. In the year 2012, this farm type had 348 cows and represented over 50% of the milk produced in New Zealand. In this time frame, the size of the typical average dairy farm had increased from 220 to 348 cows per farm. The milk yield has increased from 4000 to over 4500 kg milk ECM / cow in that year. Besides the costs in NZ-$, the exchange rate as an index and the costs in US-$ are shown.
In US-$ terms, milk production costs almost tripled in the time frame 2000 2012. The costs increased from 12 US-$ per 100 kg milk in 2000 to a level of over 35 US-$ in 2011. Cost reduction in 2012 was an effect of very good weather condition and related to that good milk production per ha.
The increase of costs in US-$ can be explained by the increasing cost per kg milk in NZ-$ which showed an increase of 52%. This was driven mainly by rising prices for land and labour which increased by 150%. As dairy farmers in New Zealand do not use purchased compound feed that much, the rising world feed prices have not affected the milk production costs.
The second driver was the appreciation of the NZ-$ to the US-$. In the year 2000, the exchange rate was 2.2 NZ-$ per US-$. In the year 2012, this rate dropped to 1.24 NZ-$ per US-$. This was an appreciation of the NZ-$ of 44%. For agriculture, appreciating currencies means increasing costs in the currency used for comparison.
The example of the year 2008/2009 shows how fast a devaluation of the NZ-$ decreased milk production costs in US-$. In this time, the exchange rate was fluctuating between 1.3 1.9 NZ-$ / US-$.
Figure 4 illustrates the costs of milk production of selected typical farms the IFCN had been analysing over a certain period of time. The first two letter of the farm describe the country. The numbers describe the farm size in number of cows per farm. The codes after the number illustrate the region, e.g. WI represents the region of Wisconsin in the USA. Technical comment: The costs for the farm CN-340 have been indexed backwards in the years 2000 2005, using IFCN based on feed prices and technical progress on the farm.
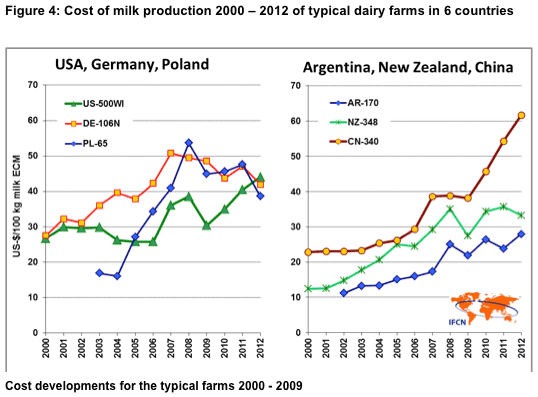
Germany (DE-106N): This typical farm with 106 cows represents approximately 60-70% of milk production in Northern Germany. In the year 2000, the costs were with 28 US-$ / 100 kg milk similar like the US dairy farm. From 2000 - 2006 the cost increased towards 42 US$ per 100 kg milk. The key driver was the appreciation of the Euro (+36%) and moderate increase of costs in Euro terms. In the year 2007, a significant increase of the costs indicator was observed as direct payments were decoupled from the dairy enterprise and lowered the non-milk returns by 7 US-$ per 100 kg milk.
From 2008 2012, the costs showed a declining trend towards 42 US-$ per 100 kg milk. The key drivers were a) a devaluation of the Euro by 14% and b) the effect that the typical farm in the quota exit phase increased the farm size from 80 to 106 cows. These two effects have in US-$ terms over-compensated the effect of higher feed and energy prices.
Poland (PL-65): This farm type represents a larger family farm type in Poland, producing about 30 -40% of the total milk in Poland. This Polish farm had very low costs in the time 2003 and 2004 and was almost as cost competitive as dairy farms in New Zealand. After joining the EU, costs increased from 17 US-$ to 53 US-$ per 100 kg milk in 2008. This was driven by an increase of wages, land prices and an appreciated currency against the Euro. This increase could not been compensated by an increasing farm productivity. After 2008, the farm type followed a similar cost trend like the German dairy farm. The 20% reduction in costs in 2012 was a result of the devaluation of the Zloty (-7%) and improvements in farm efficiency like milk yield, land and labour productivity.
USA (US-500WI): This farm type represents a larger family farm type and roughly 30% of milk in the USA. In the US, costs were relatively stable from 2000 to 2006 as inflation driven change of input prices could be compensated by increasing milk yields. Once feed prices started rising, this had a direct impact on this farm and costs increased by 50% to a level of 38.5 US-$ per 100 kg milk. The sharp drop in costs 2009 can be interpreted as a result of very bad milk prices where farmers tried to cut costs wherever possible. Until the year 2012, cost had increased mainly driven by feed prices - towards 44 US-$ per 100 kg milk. The US dairy farms had a significant cost advantage towards larger family farms in Germany for over 10 years. In the year 2012, the costs were on a similar level.
China (CN 340): This typical farm with 340 cows represents a larger farm type in China but not the very large farms. We estimate that this farm type represent 30 -40 % of the milk produced in China. The costs on the Chinese farm were rising steadily from 2000 to 2005, following increases in feed and labour prices. Since 2006, an additional increase in cost due to the appreciation of the Yuan could be seen. In 2012, the Yuan had gained value by + 25% to the US-$ compared to 2000. The costs on the Chinese farm did not drop sharply in 2009 as was observed in most other countries, because the drop in prices in national currency was almost fully compensated by the appreciation of the Yuan. From 2010 till 2012, the rising feed prices were a strong driver for increasing cost of production.
Argentina (AR-170): This farm represents an average sized farm in Argentina which keep about 40-50% of the cows. The costs of the 170 cow farm in Argentina have more than doubled since 2002. Nevertheless, the positive trend has slowed in the last 5 years and costs have become more volatile. After a cost decrease in 2011, an increase could be experienced again in 2012. This latest development was mainly driven by a decrease in milk yield due to unfavorable weather conditions.
New Zealand (NZ-348): The typical farm representing an average sized farm in New Zealand was a cost leader in milk production in the year 2000. IFCN identified costs of 12 US-$ per 100 kg milk, which was the lowest cost level those days. Driven by an increase of input prices and an appreciating currency, costs increased to a level of 35 US-$ per 100 kg milk. Based on the typical farms chosen for this analysis, the costs in New Zealand were approx. 20% higher than in Argentina and ca. 20% below the costs level in the US and Germany in 2012.
Summary
This article summarises the research work of the IFCN International Farm Comparison network which has been analysing dairy farm economics since the year 2000. In the year 2013, over 50 countries participated in the annual comparison on costs of production and 95 countries participated in the country profile analysis. The results of this article are summarised as follows:
122 million dairy farms on this planet keeping on average 3 cows per farm
Based on IFCN data collection and estimation, there were 122 million dairy farms and farming households on this planet in 2012. The average dairy farm size has 3 cows or buffaloes with an average milk yield of 2100 kg milk ECM / milk animal.
Very volatile milk and feed prices - a challenge for dairy farming
Via standardised world milk and feed prices, IFCN tracks the overall farm economic situation for dairy farming. The IFCN developed an indicator "margin over compound feed costs" which is a significant improvement compared to the often used milk : feed price ratio. By using this margin, it becomes visible how much threat dairy farmer's face in a situation like in summer 2012, when milk prices fell and feed prices increased. Within 8 months, this situation changed considerably and dairy farm economics improved significantly especially in countries where the high world market prices of milk were transmitted by local dairies to farmer milk prices.
Costs to produce milk differs significantly the range is from 4 to 128 US-$ per 100 kg milk
Based on the IFCN cost comparison, 178 typical farms in 51 countries were analysed. Cost of milk production ranged from 4 US-$ per 100 kg milk in extensive farming systems in Cameroon to 128 US-$ for an average sized farm type in Japan. The simple average cost over all countries analysed was 46 US-$/100 kg milk.
From 2000 2012, cost of milk production increased in all countries analysed
As the IFCN has analysed typical dairy farms since the year 2000, a time series analysis was possible. The results show that costs in a specific country can double or triple within 3-6 years. This is especially the case for countries like Poland, China, New Zealand where the value of the currency has significantly strengthened to the US-$ and farm input price like land, feed, and labour have increased significantly.
Cost of milk production in China is estimated 50% above the level in US and Germany
An extreme case was observed in China where dairy farming highly depends on purchased feed. In addition, China had the strongest increase in salaries and an appreciation of the currency of 24%. The combined effect of these factors drove the costs in China to about 50% above the level in US and Germany.
Annual benchmarking a part for strategic dairy development and milk sourcing
In times of significant change in dairy related output prices, farm input prices and exchange rates it is extremely important to benchmark the competitiveness of the current dairy farming system annually. Competitiveness means in this sense costs competitive on the market for dairy products and also competitive on the local market for production factors especially land and labour. Such benchmarking exercise enables all dairy stakeholders to see and react faster to threats but even more to anticipate opportunities which will arise.
10.28.2013