
By Jim Dunn
Professor of Agricultural Economics
Penn State University
?Market Psychology
Cheese prices have been rising this past month, rising 16 cents/lb. in a fairly steady climb. Expectations are that cheese demand will be good enough to maintain strong prices through the autumn. In contrast the butter price, although just as volatile, spiked in mid-month and ended up to 18 cents/lb. more than last month at this time. One positive for butter is the strong cheese market.
Non-fat dry milk prices have drifted down 1%, while dry whey is down 1.1%. The dollar's value is up somewhat except against the euro, where it is unchanged. The Australian dollar down 2.2% and the New Zealand dollar fell by 4.5%. The European Union is attempting to solve the continuing challenges of the Greek economy, which has undermined the single currency strategy with Greece's inability to handle its pension challenges and deficits. The weak Chinese economy is especially hurting Australia and New Zealand, since they are particularly tied to Asian markets, not only for dairy, but also for many other items. El Niño, which usually adversely affects milk production in Australia and New Zealand, is not having much of an impact, which means plenty of milk for dairy exports, despite the lack of markets.
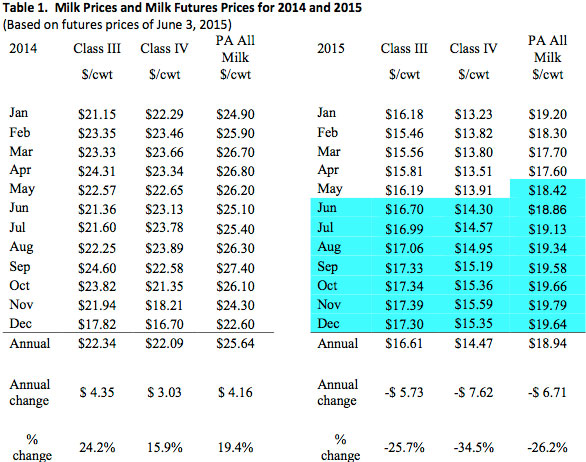
Table 1 lists some past and estimated future milk prices. I estimate the May Pennsylvania all-milk price to be $18.42/cwt, up $0.82 from April. The dairy futures market prices for Class III and IV show higher prices in the rest of 2015. The May Class III price was up $0.39 from April at $16.19/cwt. The latest Class III futures prices for the rest of 2015 average $17.16. The May Class IV price was up $0.40/cwt. from April at $13.91/cwt. The Class IV futures prices are higher for the remainder of 2015, averaging $15.04 for the next 7 months. My forecast for the average Pennsylvania all-milk price for 2015 is $18.94/cwt., which is
$6.71/cwt. below 2014.
The strong U.S. dollar continues to challenge U.S. exporters of dairy products. Dairy exports have fallen significantly since their highs of midyear 2014, as the strong dollar, the weaker Chinese economy, and the Russian embargo all are hurting US exports. Although the Russian embargo could have hurt the European Union's dairy exports, the weak euro has opened markets ordinarily served by the United States, including even some to Mexico. With EU milk production increasing, along with Australia and New Zealand, US exports could continue to suffer.
Corn and Soybean Markets
Corn and soybean markets are weakening, as the strong dollar and the weaker world economy are hurting these exports as well. The biggest factor here is the good weather in the Corn Belt, which has helped the farmers to get the crop in the ground and off to a good start. Of course, inventories are high from the 2014 crops, and the lagging exports mean that we should have lots of both corn and beans when the crop is harvested and a large carryover into 2016. This portends low feed prices for the next year. The drought in the Southern Plains of the last several years has been broken with the recent torrential rains, so the western hay economy should get a respite.
Income over Feed Costs (IOFC)
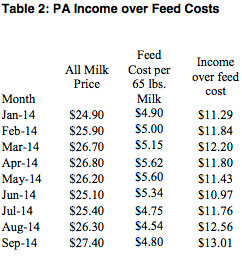
Penn State's measure of income over feed costs rose by 8% in May, as milk prices rose and feed prices stayed the same. Figure 1 shows how these values compare to recent years. May's feed cost is 3¢/cow/day more than in April. May's value for IOFC of $6.79/cow/day is well below the 2014 value, when the milk price was very high and feed prices were moderate. The large drop in the milk price is the driver of the lower IOFC, although feed costs are slightly lower than last year at this time. Income over feed cost reflects daily gross milk income less feed costs for an average cow producing 65 pounds of milk per day. Figure 1 and Table 2 showing the monthly data follow.
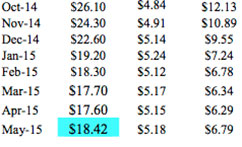
The allocation of the revenue per hundred pounds of milk (milk margin) is shown in Table 3. The milk margin is the estimated amount of the Pennsylvania all milk price that remains after feed costs per hundredweight of milk production are paid. Like income over feed cost, this measure shows that the May PA milk margin was 8% higher than in April.
Milk Production
The latest milk production report showed April milk production up 1.8% from a year earlier, a sizable increase over the slower growth of recent months (Figure 2). This increase in milk production does not bode well for milk prices, especially with the decreased exports of dairy products and the overall malaise in the global economy, especially in China. The monthly cow numbers are shown in Figure 3. The March cow numbers only rose by 0.75%. Of course with Spring here milk per cow should rise, but the year over year increase continues to be the source of milk production growth. This is despite falling milk production in the West with the drought in California and the more expensive feed in the West. The Midwest in particular is expanding production, which is seen by some shipments overwhelming the processors' ability to accept it. Idaho is now the third largest dairy state, having passed New York once again. Pennsylvania is fifth with Texas a close sixth.
6.10.2105