
Dairy Outlook March 2015
By Jim Dunn
Professor of Agricultural Economics, Penn State University
Market Psychology
Cheese and butter prices have changed slightly in the past month, while the powdered product prices have moved in opposite directions. Non-fat dry milk prices are up 3.8%, while dry whey is down 11.8%. The dollar is still rising, with the Euro continuing to drop. The U.S. economy is very strong, while Europe is stagnant. U.S. dairy exports continue to be weak, with the dollar rising compared to the currencies of the other major dairy exporters, and Chinese dairy imports are falling. Despite fewer exports, milk production continues to grow. Butter prices have done little since a drop in early February. I was on a family vacation in New Zealand in mid-February and it is very dry where I was. We weren't everywhere, but the pastures resembled summer in South Dakota more than Ireland or even Pennsylvania. They were decidedly brown. Australia is also dry, which is more the norm, but the drought in both countries is expected to cause lower milk production.
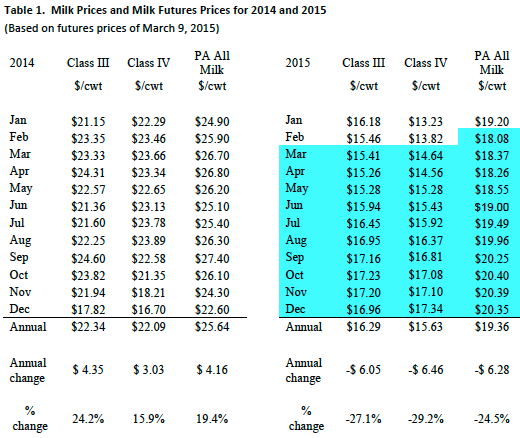
Table 1 lists some past and estimated future milk prices. I estimate the February Pennsylvania all-milk price to be $18.08/cwt, down $1.12 from January, but the actual number will be released in early March. Milk production growth continues to be high, and the futures market prices for Class III and IV have drifted lower for the first half of 2015. The February Class III price was down $0.72 from January at $15.46/cwt. The latest Class III futures prices for the rest of 2015 average $16.38, with Class III futures prices below $16.00 through June, and higher prices for the remainder of 2015. The average Class III futures prices for all of 2015 are $16.53. The February Class IV price was up $0.59/cwt. from January at $13.82/cwt. The Class IV futures prices are higher for the remainder of 2015, averaging $16.05 for the next 10 months. My forecast for the average Pennsylvania all-milk price for 2015 $19.36/cwt., or $6.28/cwt. below 2014.
The U.S. dollar is up against the Euro and the Australian and New Zealand dollars since my last report, with the Aussie dollar down 3.9% and the New Zealand dollar and the Euro down 0.3% and 4.3% respectively. The strong U.S. dollar continues to hurt all U.S. agricultural exports, including dairy products. With the falling exports, the increased milk production will weaken dairy prices, since our domestic market grows by much less than the recent milk-production growth rate.
Corn and Soybean Markets
Corn and soybean meal prices have risen since last month, by 0.3 and 4.4% respectively. Corn ended at $3.83/bu. for the March 2015 corn contract. The strong dollar is hurting feed exports, and the big South American corn and bean crops are hanging over U.S. markets. The struggles of the Chinese economy are hurting most agricultural commodity markets.
Income over Feed Costs (IOFC)
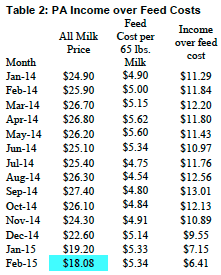
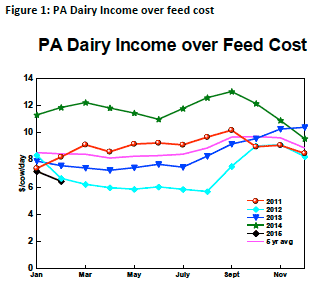
Penn State's measure of income over feed costs fell by 10.4% in February, as milk prices fell and feed prices were unchanged. Figure 1 shows how these values compare to recent years. February's feed cost is 1¢/cow/day more than in January. January's value for IOFC of $6.41/cow/day is well below the average 2014 value of $11.62, when milk prices were very high and feed prices were moderate. The change is because of the sharp drop in the milk price, while feed costs are stable.
Income over feed cost reflects daily gross milk income less feed costs for an average cow producing 65 pounds of milk per day. Figure 1 and Table 2 showing the monthly data follow.
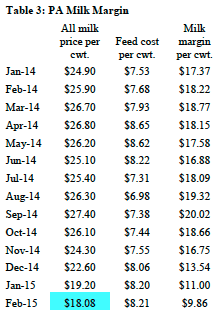
The allocation of the revenue per hundred pounds of milk (milk margin) is shown in Table 3. The milk margin is the estimated amount of the Pennsylvania all milk price that remains after feed costs per hundredweight are paid. Like income over feed cost, this measure shows that the January PA milk margin was 10.4% lower than in December.
Milk Production
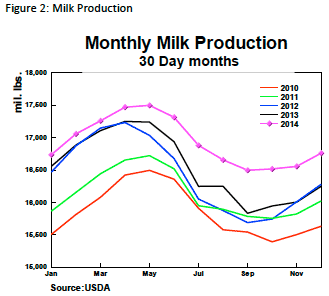
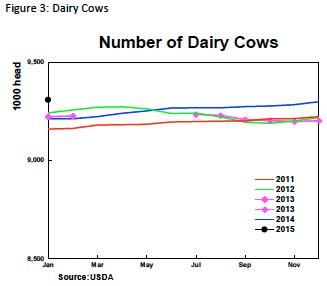
The latest milk production report showed December milk production up 2.0% from a year earlier, the seventh consecutive sizeable monthly increase (Figure 2). This is bearish, although the increase was expected. The growth in milk production is half in milk per cow and half in higher cow numbers. The national dairy herd this January is 1% greater than in January 2014. The monthly cow numbers are shown in Figure 3.
3.16.2015